
The commodities.
What A Little Bit of Queensland produces, and why it matters.
Coal, natural gas, metals and minerals: together, they power industries, support households, and underpin the technologies of tomorrow.
A snapshot of the sector’s contributions.
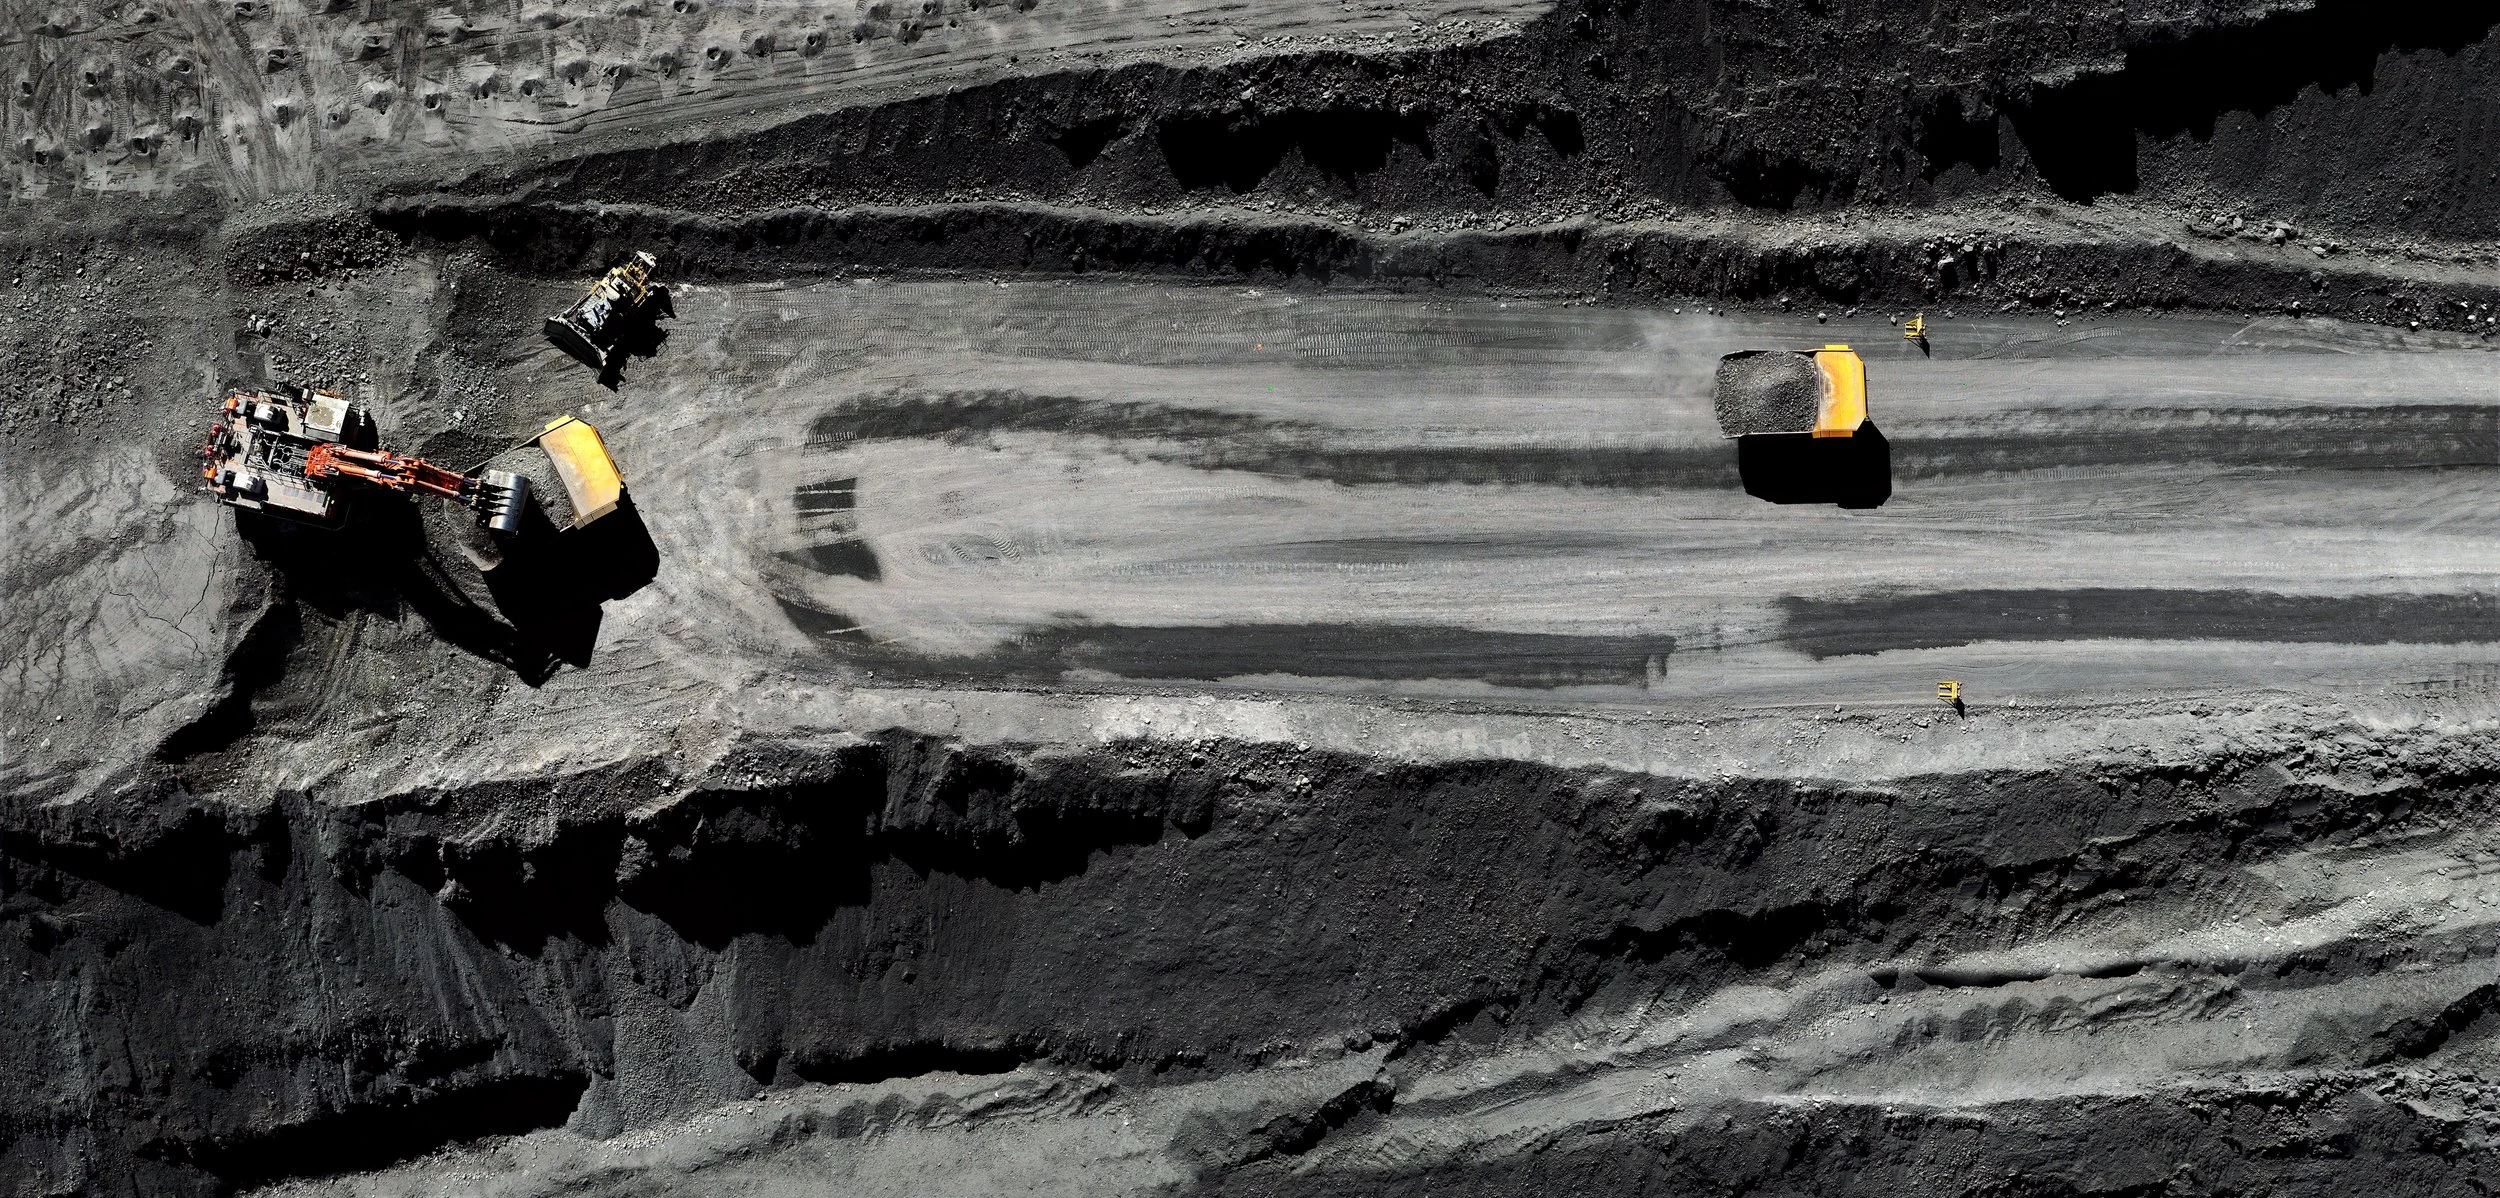
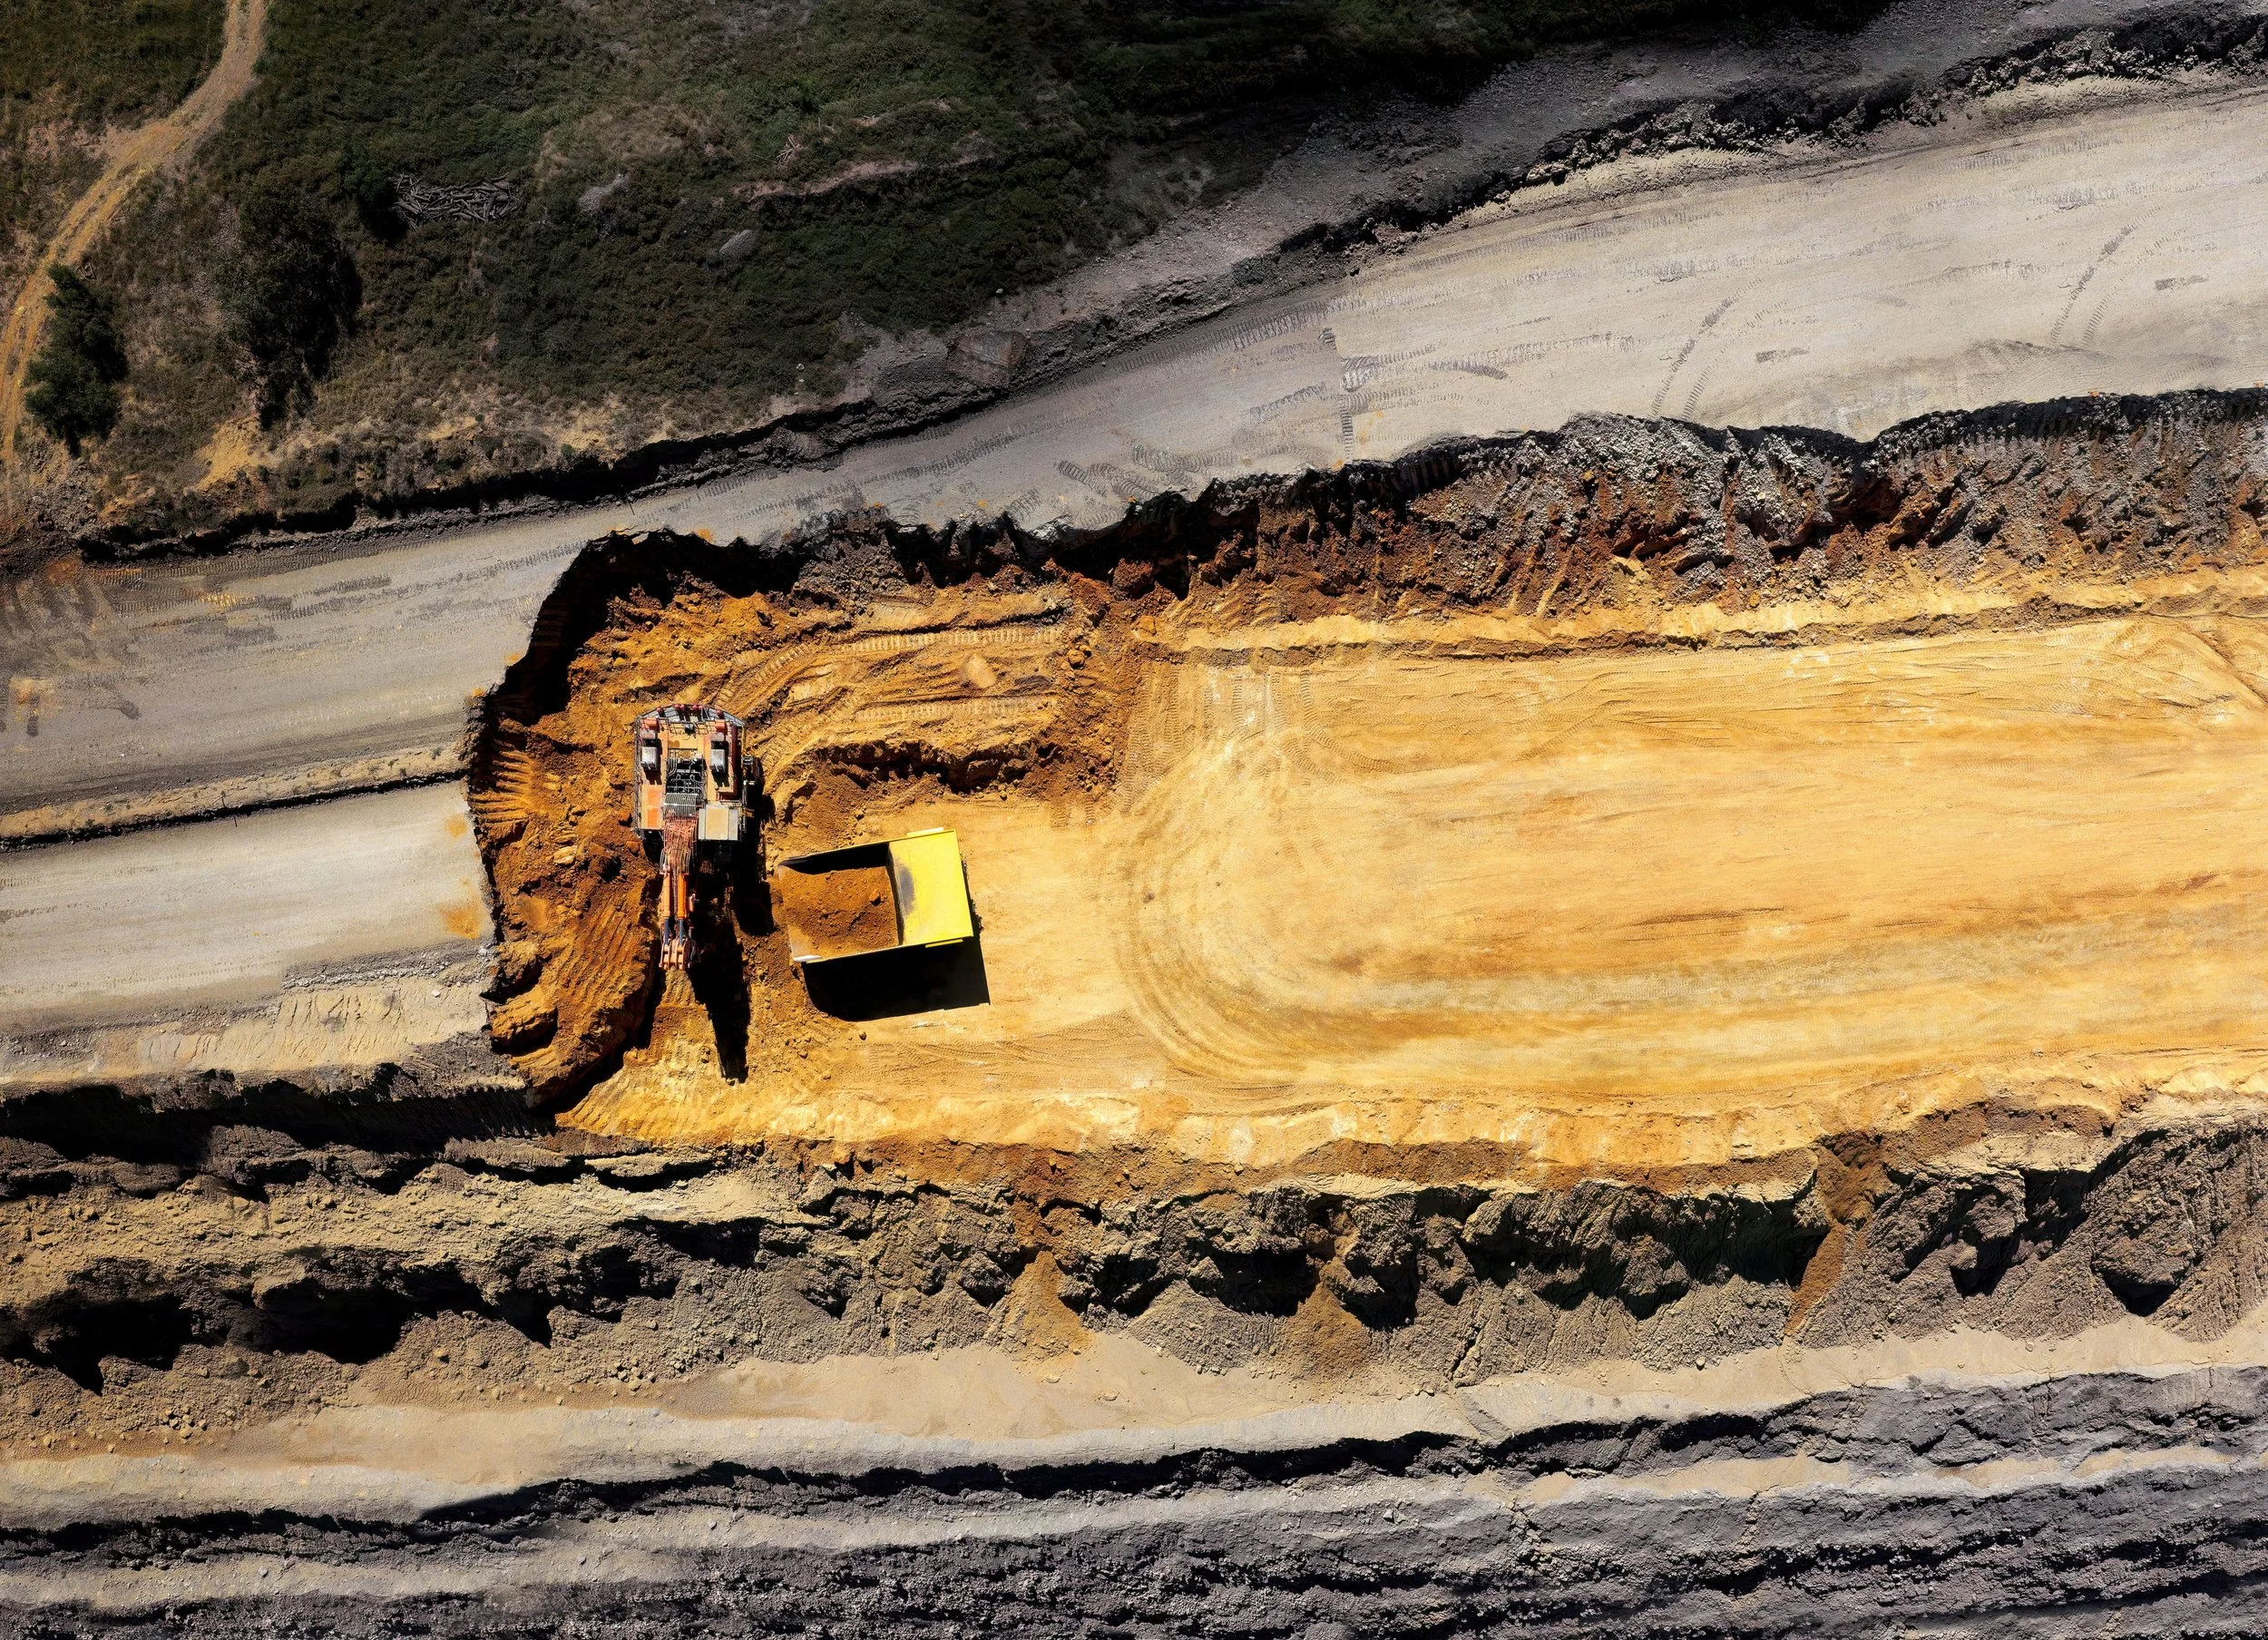
Coal.
What it’s used for steelmaking and part of today’s power mix.
Where it’s found the Bowen, Galilee and Surat basins which stretch from the south of Queensland, through central Queensland and even as far as north Queensland.
Economic snapshot largest share of statewide contribution.

Gas.
What it’s used for reliable energy for homes, industry, and firming renewables.
Where it’s found the Cooper, Eromanga, Bowen, Surat and Galilee basins which covers land from central Queensland all the way to the south and south west of the state.
Economic snapshot strong export and domestic role.

Metals.
What they’re used for copper and aluminium enable electrification, grids, and wiring.
Where they’re found North and Northwest Queensland and part of Central Queensland.
Economic snapshot steady contribution and regional jobs.

Minerals.
What they’re used for batteries, electric vehicles (EVs), renewables, and defence technology.
Where they’re found North and Northwest Queensland and parts of Central Queensland.
Economic snapshot emerging as essential for national security with high export potential.
By the numbers.
Coal contributed more than $76 billion to Queensland’s economy (15% of GRP), supporting 363,059 jobs and paying $5.5 billion in royalties. Coal operators spent $23.8 billion with 8,368 local businesses and 825 community groups, and exported over 195 million tonnes of Australia’s coal.
Gas contributed $21.7 billion to the economy (4% of GRP), supporting 94,319 jobs and paying $1.7 billion in royalties. Queensland gas operators spent $6.4 billion with 3,650 local businesses and 462 community organisations.
Metals & Minerals contributed $13.6 billion to Queensland (3% of GRP), supporting 70,845 jobs and paying $734 million in royalties, with $4.4 billion spent across 3,375 local suppliers and 280 community groups.
Learn more.
QRC tracks industry spending by collecting member expenditure data to create a detailed overview of Queensland’s major export industry, analysed down to postcode levels.
Spending is categorised as direct and indirect. Direct spending is based on QRC members’ financial records, measuring expenditures through invoices. Indirect spending is estimated through economic modelling, gauging additional economic activity generated by direct spending.
For instance, when a resource company buys a vehicle (direct spending), the dealership’s income increases (indirect spending). Similarly, a resource employee’s wage (direct spending) spent on a car also boosts the regional economy (indirect spending). Indirect spending data, though not directly collected, is estimated through advanced economic modelling by an independent consultant.
Learn more about the methodology here.